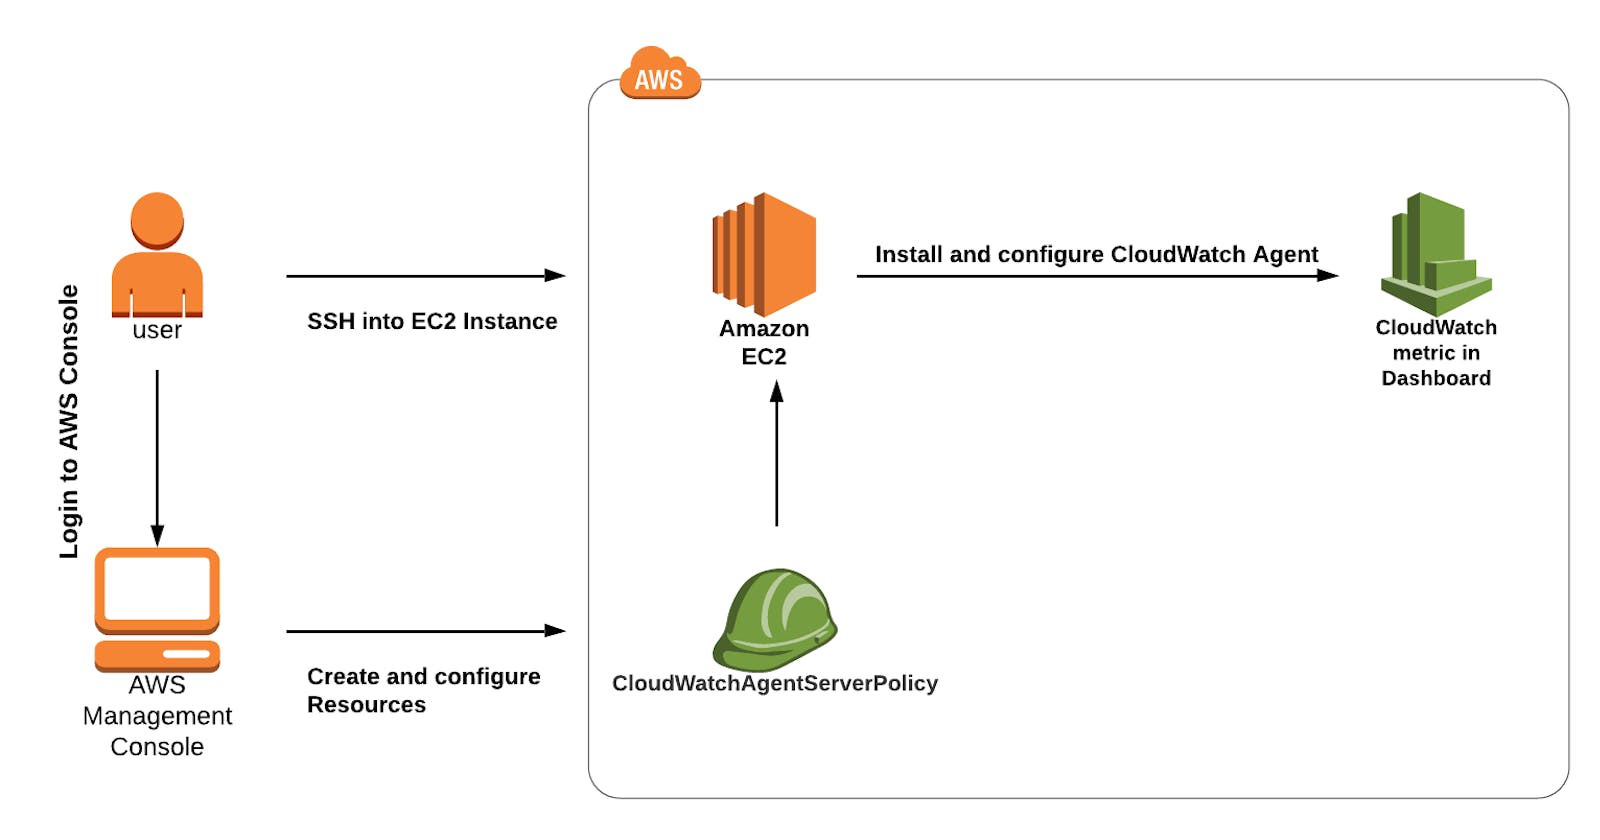
Table of contents
Lab Steps
Task 1: Sign in to AWS Management Console
Click on the Open Console button, and you will get redirected to AWS Console in a new browser tab.
On the AWS sign-in page,
Leave the Account ID as default. Never edit/remove the 12 digit Account ID present in the AWS Console. otherwise, you cannot proceed with the lab.
Now copy your User Name and Password in the Lab Console to the IAM Username and Password in AWS Console and click on the Sign in button.
Once Signed In to the AWS Management Console, Make the default AWS Region as US East (N. Virginia) us-east-1.
Task 2: Launching an EC2 Instance
In this task, we are going to launch an EC2 Instance by providing the required configurations like name, instance type, key pair, security group and IAM instance profile.
Make sure you are in the N.Virginia Region.
Navigate to EC2 by clicking on the Services menu at the top, then click on EC2 in the Compute section.
Navigate to Instances on the left panel and click on Launch instances button.
Enter Name as MyEC2Server
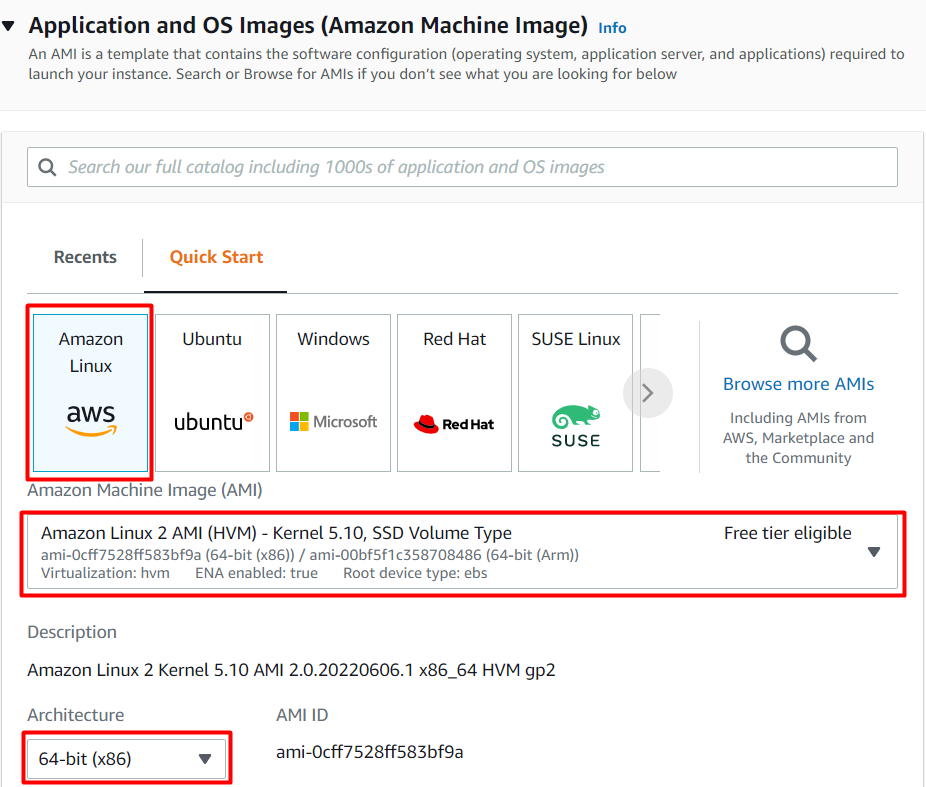
Select Amazon Linux from the Quick Start and Select Amazon Linux 2 AMI from the drop-down.
Choose Architecture as 64-bit(x86)
- Choose an Instance Type: Select t2.micro

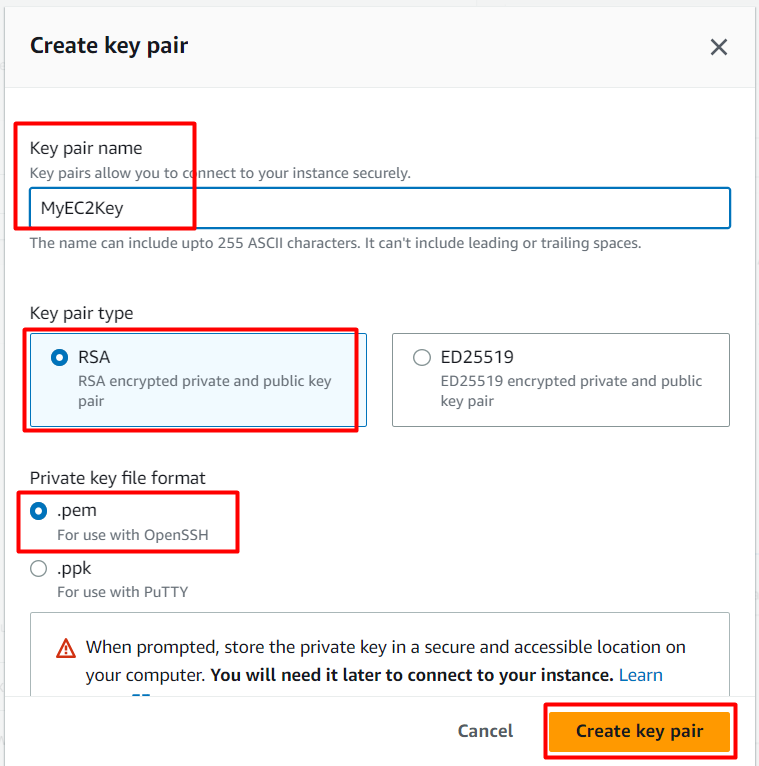
8. For Key pair: Select Create a new key pair Button
Key pair name: Enter WhizKey
Key pair type: Select RSA
Private key file format: Select **.pem
**
- Select Create key pair Button.
- In Network Settings Click on Edit Button:
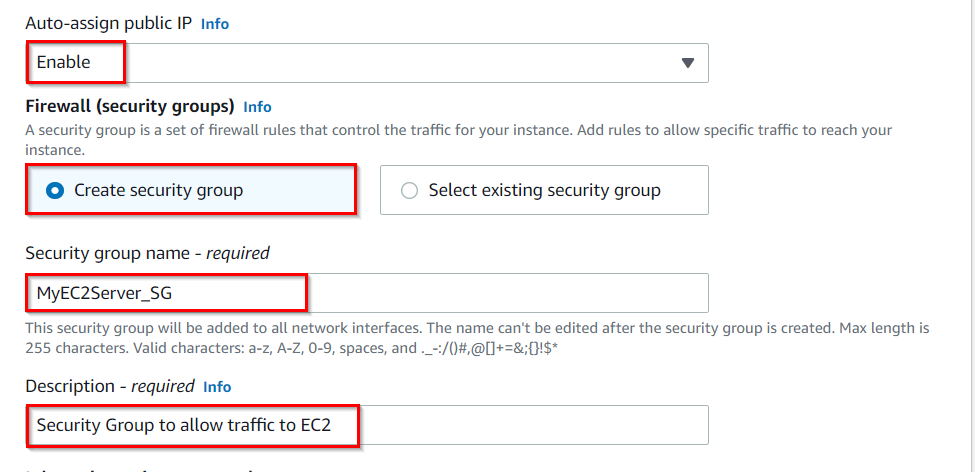
Auto-assign public IP: Enable
Select Create new Security group
Security group name : Enter MyEC2Server_SG
Description : Enter Security Group to allow traffic to EC2
To add SSH, (Ignore if already added by default)
Choose Type: Select SSH
Source: Select Anywhere
Scroll Down to Advanced Settings, Select IAM instance profile already created for you as task124_ec2_<RANDOM_NUMBER>
Leave the rest of the things as default. Click on Launch instance button.
Task 4: SSH into the EC2 Instance
- Please follow the steps in SSH into EC2 Instance.
Task 5: Download and Install the Cloudwatch Agent
In this task, we will download and install the CloudWatch agent on the EC2 Instance.
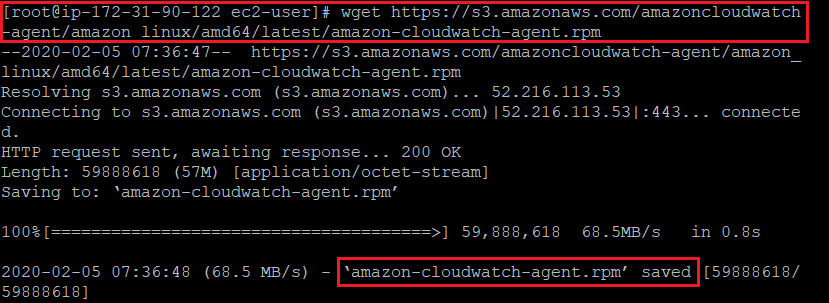
Download the Cloudwatch Unified Agent
wget https://s3.amazonaws.com/amazoncloudwatch-agent/amazon_linux/amd64/latest/amazon-cloudwatch-agent.rpm
Install the Cloudwatch Agent
sudo rpm -U ./amazon-cloudwatch-agent.rpm

Task 6: Configure and Start the Cloudwatch Agent
Open the setup wizard
sudo /opt/aws/amazon-cloudwatch-agent/bin/amazon-cloudwatch-agent-config-wizard

Enter these values asked during setup:
On which OS are you planning to use the agent? : Enter 1
Are you using EC2 or On-Premises? : Enter 1
Which user are you planning to run the agent? : Enter 1
Do you want to turn on the StatsD daemon? : Enter 2
Do you want to monitor metrics from CollectD? : Enter 2
Do you want to monitor any host metrics? Enter 1
Do you want to monitor CPU metrics per core? Enter 1
Do you want to add ec2 dimensions into all of your metrics if the info is available? : Enter 1
Would you like to collect your metrics at high resolution? : Enter 1 (1s)
Which default metrics config do you want?: Enter 2
Are you satisfied with the above config? Enter 1
Do you have any existing CloudWatch log Agent configuration file to import for migration? : Enter 2
Do you want to monitor any log files? : Enter 2
Do you want to store the config in the SSM parameter store? : Enter 2
Note: if you make any mistakes in the above configuration, you can run the configuration setup again whenever you want. The configurations that you make is saved in a JSON File.
Start the Agent:
sudo /opt/aws/amazon-cloudwatch-agent/bin/amazon-cloudwatch-agent-ctl -a fetch-config -m ec2 -c file:/opt/aws/amazon-cloudwatch-agent/bin/config.json -s

Check Agent Status
systemctl status amazon-cloudwatch-agent

Task 7: View the CloudWatch Metrics
Navigate to CloudWatch by clicking on the Services menu available under the Management and Governance section.
Make sure you are in the N.Virginia Region.
Click on All Metrics under Metrics in the Left Panel.
You should be able to see CWAgent under All Metrics (Custom Namespaces).
Note: If you are not able to see CWAgent, please wait for at least 2 minutes and then refresh the browser page.
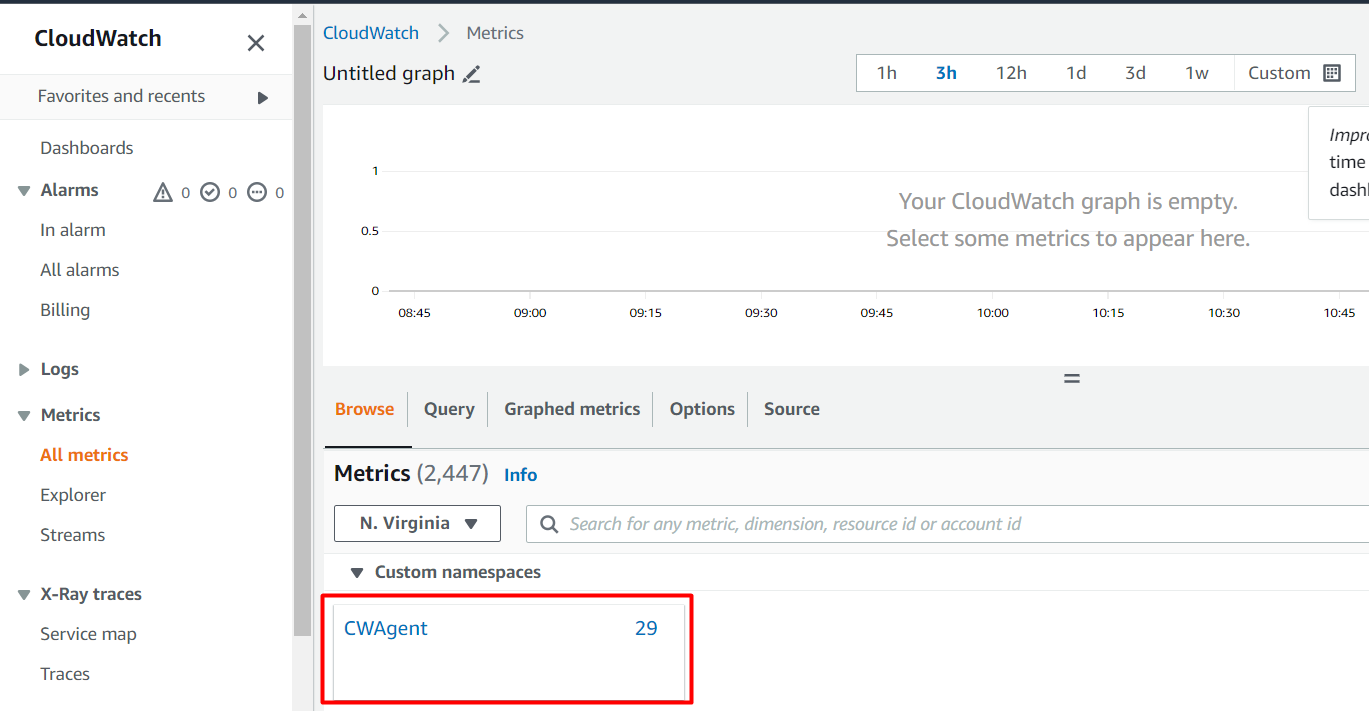
- Click on the CloudWatch Agent and you will be able to see visuals for that metric

Do you know?
The CloudWatch Logs Agent is configured through a JSON-formatted configuration file. This file specifies the log files to monitor, the log group to send the data to, and other parameters such as log rotation settings and timestamps.
Task 5 : Validation Test
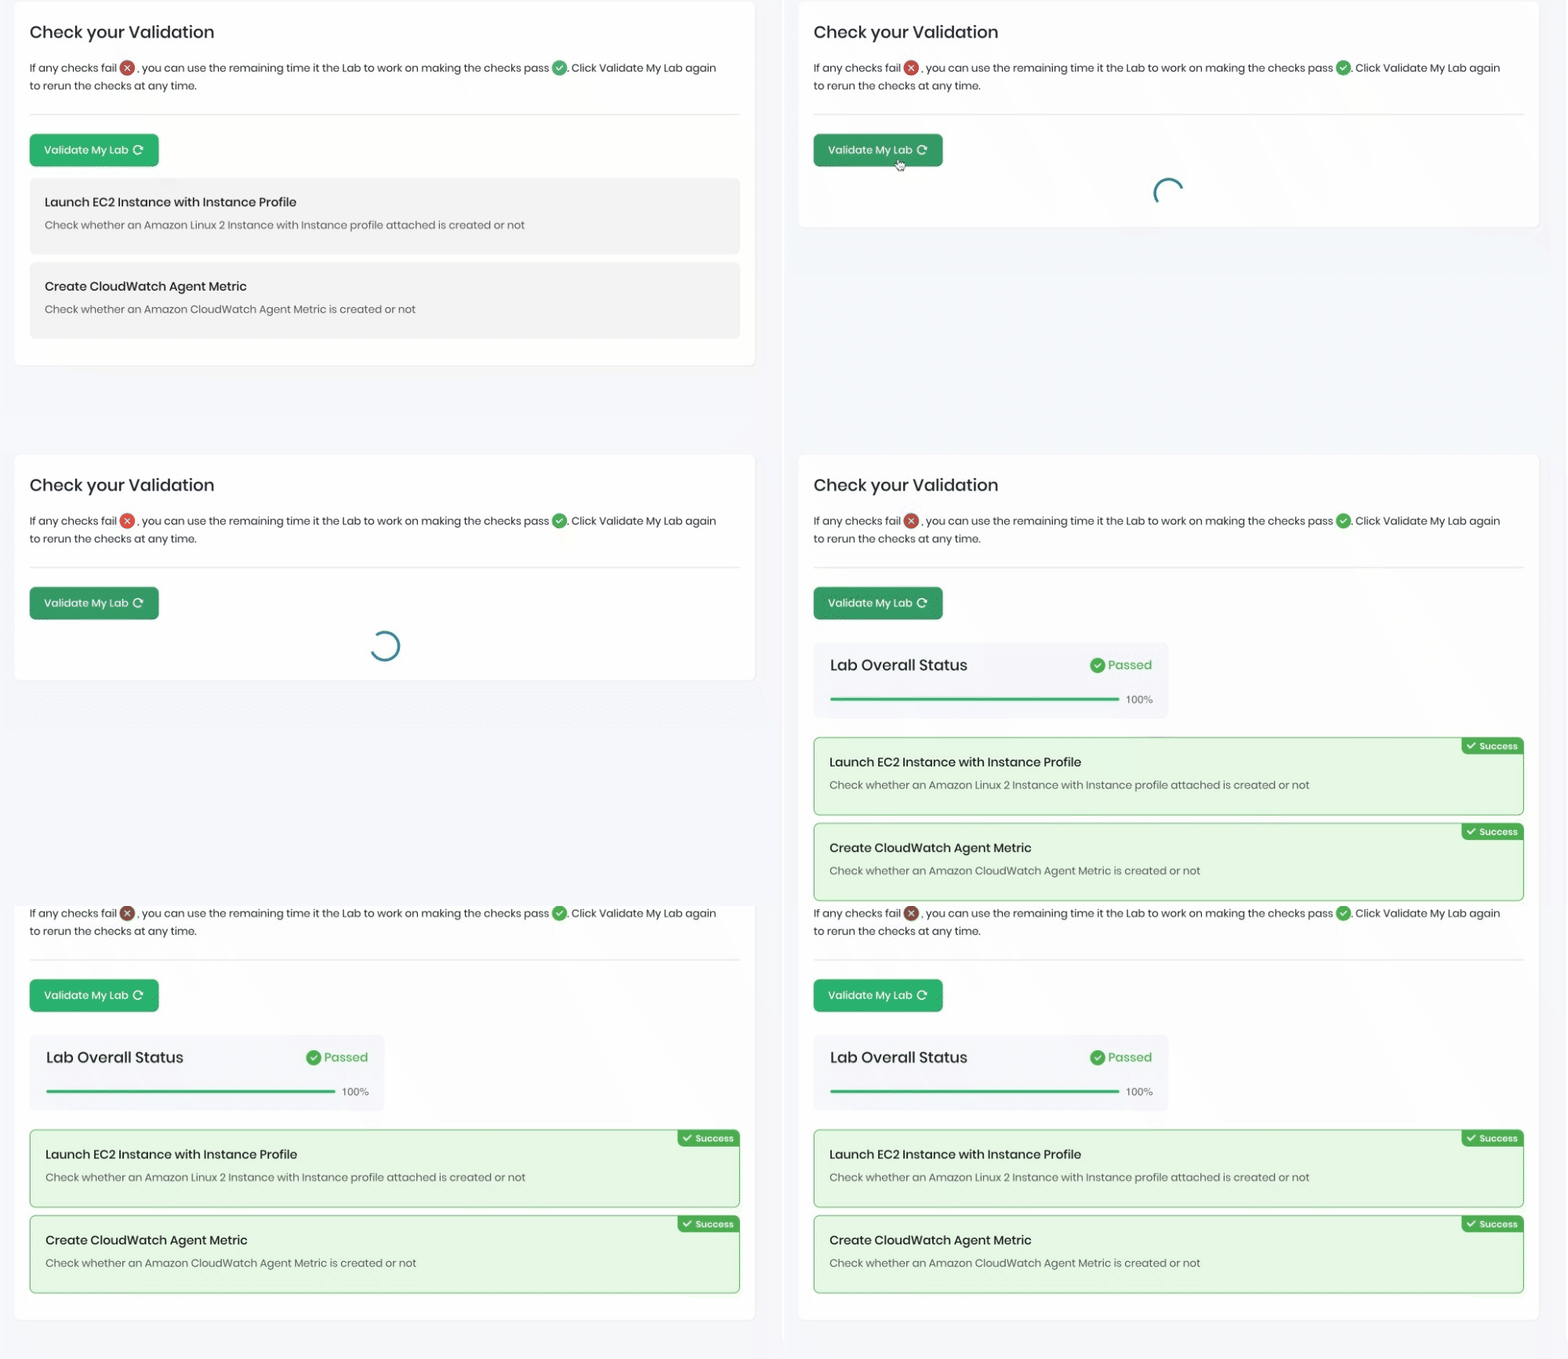
Once the lab steps are completed, please click on the Validation button on the left side panel.
This will validate the resources in the AWS account and displays whether you have completed this lab successfully or not.
Sample output :
Completion and Conclusion
You have created an EC2 Instance.
You have successfully accessed the EC2 instance via SSH.
You have downloaded and installed the CloudWatch Agent.
You have configured and started the agent.
You have viewed a cloud metric in CloudWatch.
End Lab
Sign out of AWS Account.
You have successfully completed the lab.
