Table of contents
Lab Steps
Task 1: Sign in to AWS Management Console
Click on the Open Console button, and you will get redirected to AWS Console in a new browser tab.
On the AWS sign-in page,
Leave the Account ID as default. Never edit/remove the 12 digit Account ID present in the AWS Console. otherwise, you cannot proceed with the lab.
Now copy your User Name and Password in the Lab Console to the IAM Username and Password in AWS Console and click on the Sign in button.
Once Signed In to the AWS Management Console, Make the default AWS Region as US East (N. Virginia) us-east-1.
Select Maybe later in New AWS Console Home page pop-up
Task 2: Creating a CloudTrail
Make sure to choose the N.Virginia region in the AWS Management console dashboard (present in the top right corner).
Navigate and click on CloudTrail, which will be available under the Management & Governance section of Services.
Click on Create Trail on the right side.
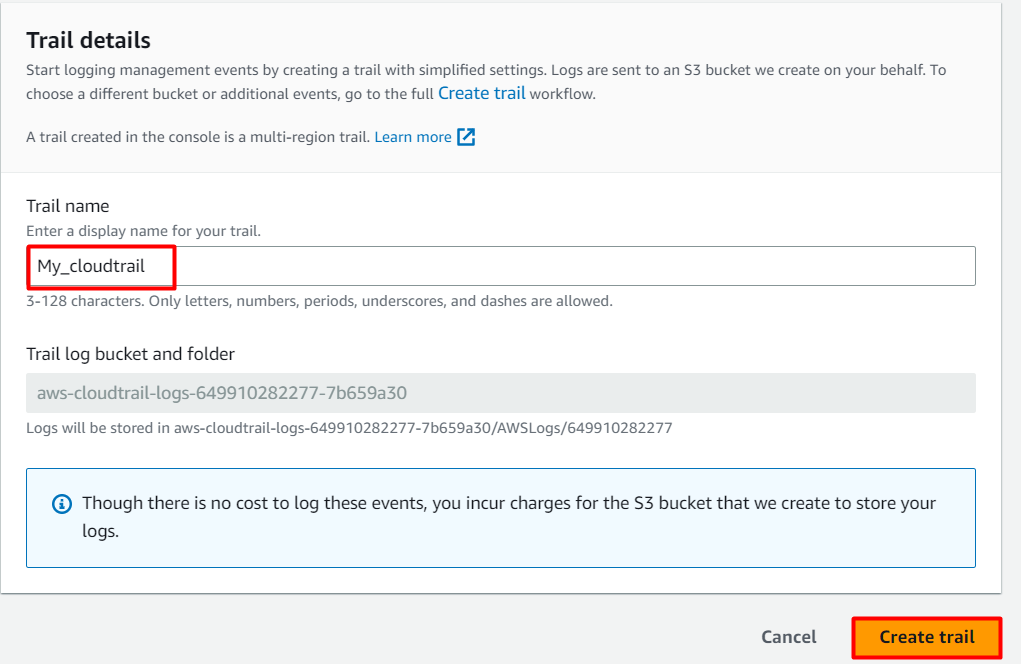
Under Create Trail, enter these details:
- Trail name: Enter My_cloudtrail.
Select the trail you have created, click on it. Scroll down you can see Cloudwatch logs section.
Click on the Edit button.
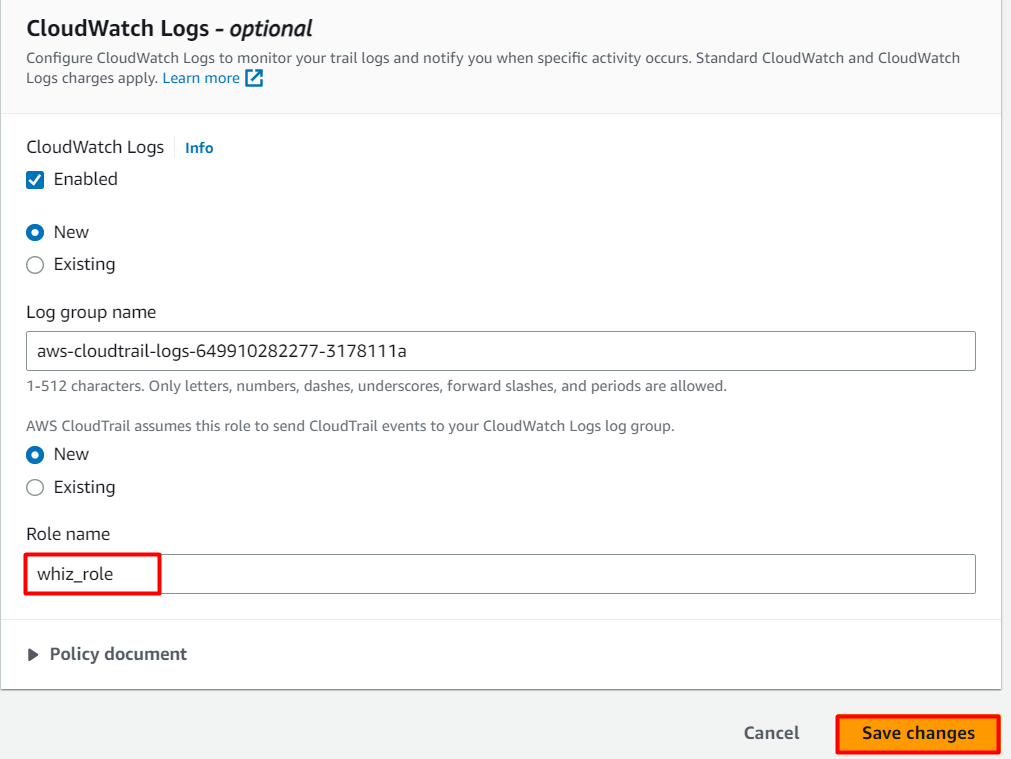
CloudWatch Logs : Check Enabled
Log group : Leave it as default (i.e New and default log group name)
IAM Role : Select New and give the Role name as whiz_role.
Click on Save changes button
Tags-optional:
Key: Enter Name
Value: Enter my_logs
Click on Save changes button
- A CloudTrail instance that delivers logs to an S3 bucket has now been created.

Task 3: Creating Metric Filters for Log Groups in Cloudwatch
Make sure you are in the N.Virginia Region.
Click on Services and navigate to the CloudWatch dashboard under Management & Governance.
Click on Log groups under Logs in the left panel.
Click on the log group we just created and click on the Actions.
Click on create metric filter as shown below:
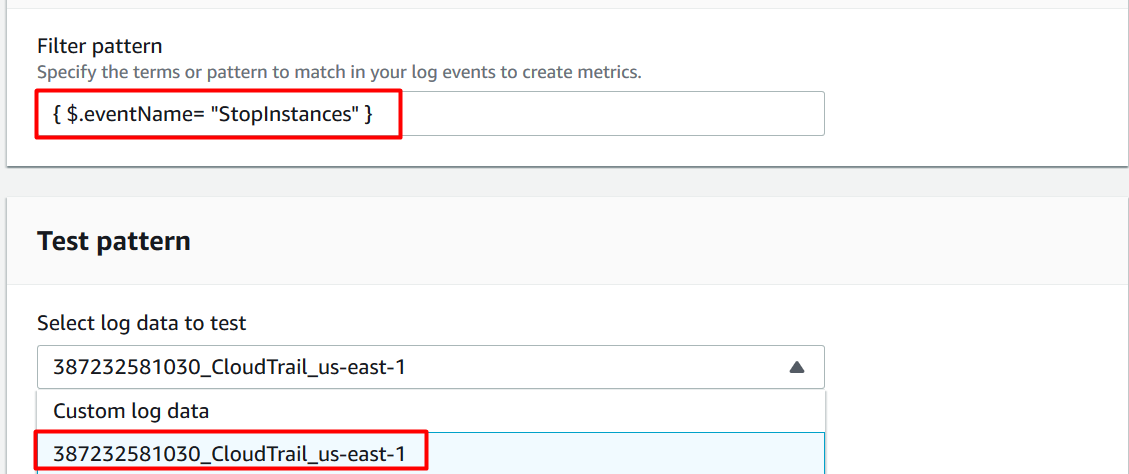
Under Create filter pattern, provide the pattern you need to filter on. For this lab, we are going to filter for stopped instances.
Filter pattern : Enter the pattern { $.eventName= "StopInstances" }
Select log data to test : Select the cloudtrail log in drop-down.
- After completing the above steps, click on Next.
- Next we will create a filter using the following details:
Filter name: Enter stoppedInstancecount
Metric details:
Metric namespace : Enter CloudTrailMetrics
Metric name : Enter EC2stoppedInstanceEventCount
Metric value : Enter 1
Default value : Leave default
Finally, click on and Next review the given details. Click on Create metric filter to complete the metric filter creation.
Task 4: Creating an Alarm
In CloudWatch, select the log group created for our CloudTrail and then click on metric filters at the bottom.
Select the Metric filter created in the above step and then click on create alarm as shown below:
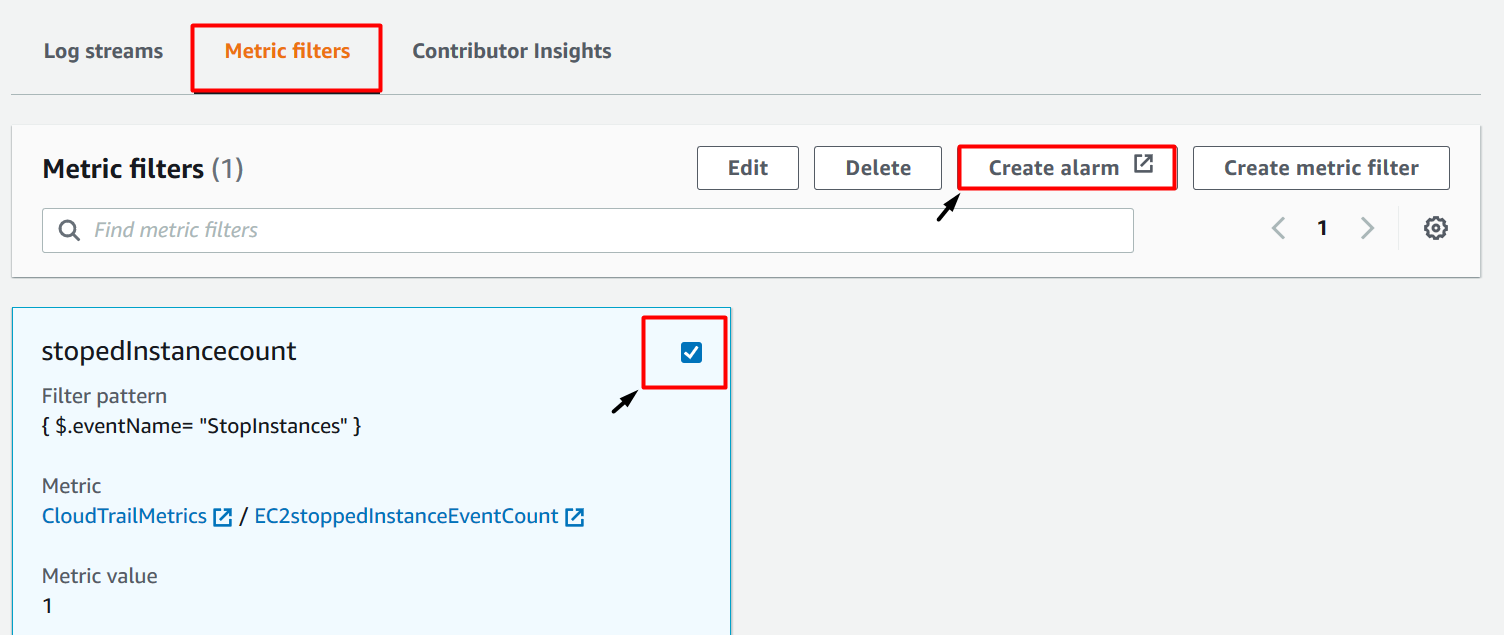
- Specify the metric conditions as follows:
Namespace : CloudTrailMetrics (default)
Metric name : EC2stoppedInstanceEventCount (default)
Statistic : sum (default)
Period : 5 minute (default)
Conditions:
Threshold type: Select Static
Whenever EC2stoppedInstanceEventCount is : than 1.
Click on Next.
- Next we'll configure actions
Alarm state trigger : Select in alarm
Select an SNS topic : select Create new topic
Create a new topic : Enter the topic name as My_Ec2count_topic
Email endpoints that will receive the notification : Enter your Email address to receive the alert
Once you provide these details, click on create topic.
AWS will send a confirmation email to the Email address provided above. You will need to confirm the email subscription
Note: If you are not getting any mail from AWS confirmation, Please check your spam
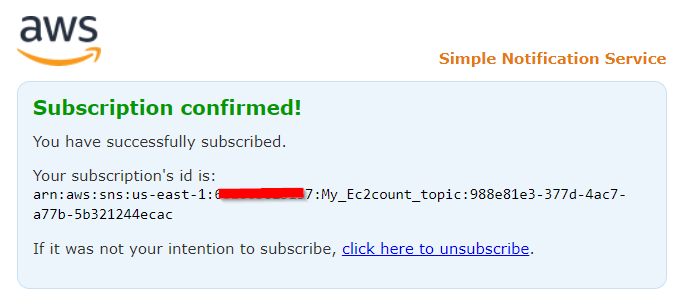
- Click on the next button to complete the alarm creation.
- Give the name for your alarm and complete the steps as shown below:
Alarm name : Enter My_stopped_ec2_alarm
Alarm description : Enter Alarm to count the stopped instances count
Review the details and click on create alarm.
- Navigate to the CloudWatch dashboard and click on alarms. You should see the alarm created in the above step under insufficient data as shown below:

Task 5: Creating an EC2 Instance to Trigger our Alarm
Make sure you are in the N.Virginia Region.
Navigate to EC2 by clicking on the services menu in the top, then click on EC2 in the Compute section
Navigate to Instances on the left panel and click on launch instances
Name : Enter MyEC2Server

For Amazon Machine Image (AMI): Select Amazon Linux 2 AMI in the search box.
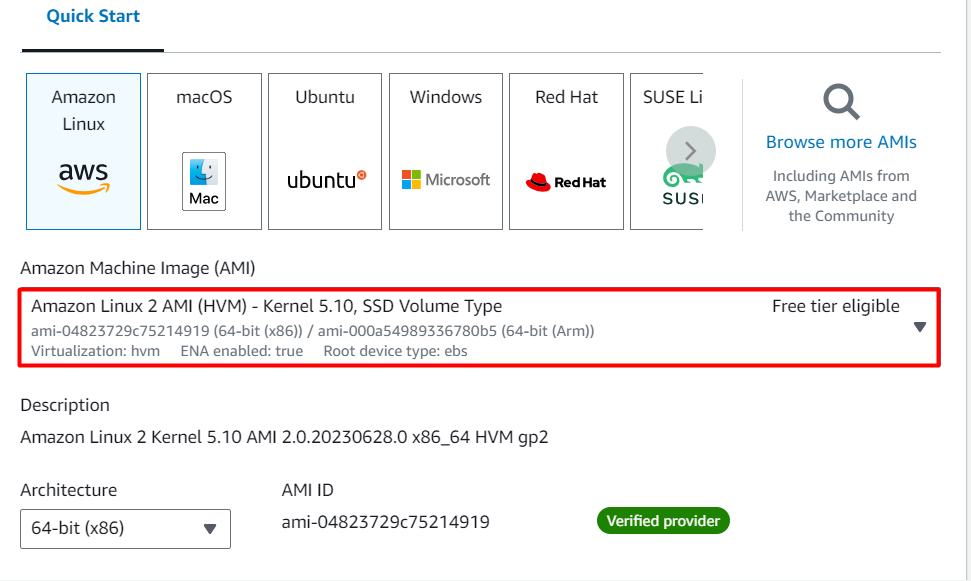
Note: if there are two AMI's present for Amazon Linux 2 AMI, choose any of them.
- For Instance Type: select t2.micro

For Key pair: Select Create a new key pair Button
Key pair name: WhizKey
Key pair type: RSA
Private key file format: .pem
Select Create key pair Button.
In Network Settings Click on Edit:
Auto-assign public IP: Enable
Select Create new Security group
Security group name : Enter MyEC2Server_SG
Description : Enter Security Group to allow traffic to EC2
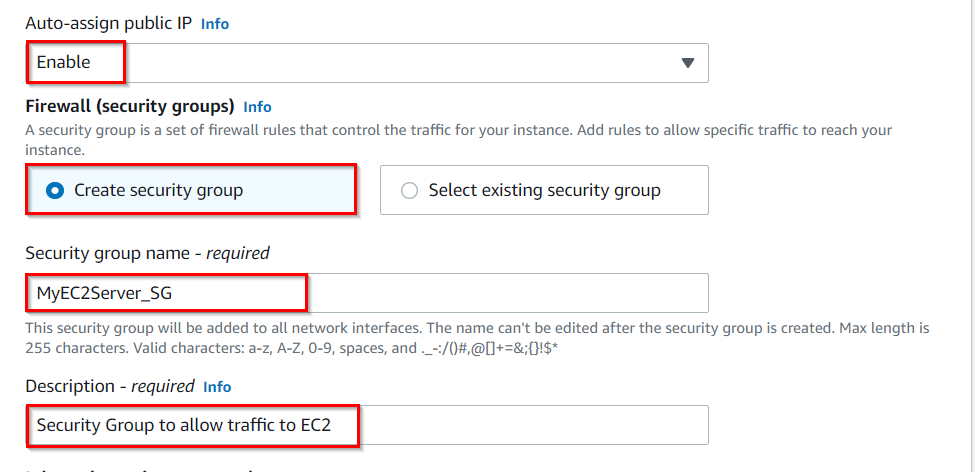
Check Allow SSH from and Select Anywhere from dropdown
To add SSH,
Choose Type: SSH
Source: Select Anywhere
Keep Rest thing Default and Click on Launch Instance Button.
Select View all Instances to View Instance you Created
Launch Status:Your instance is now launching, Click on the instance ID and wait for complete initialization of instance.

13.Once the EC2 instance launches successfully, start and stop the instance 2 to 3 times as shown in the below screenshot:

14.Navigate to the CloudWatch console and click on In alarm under Alarms on the left side panel to see the newly-created alarm. It should show the state as In alarm, as shown below:

Do you know?
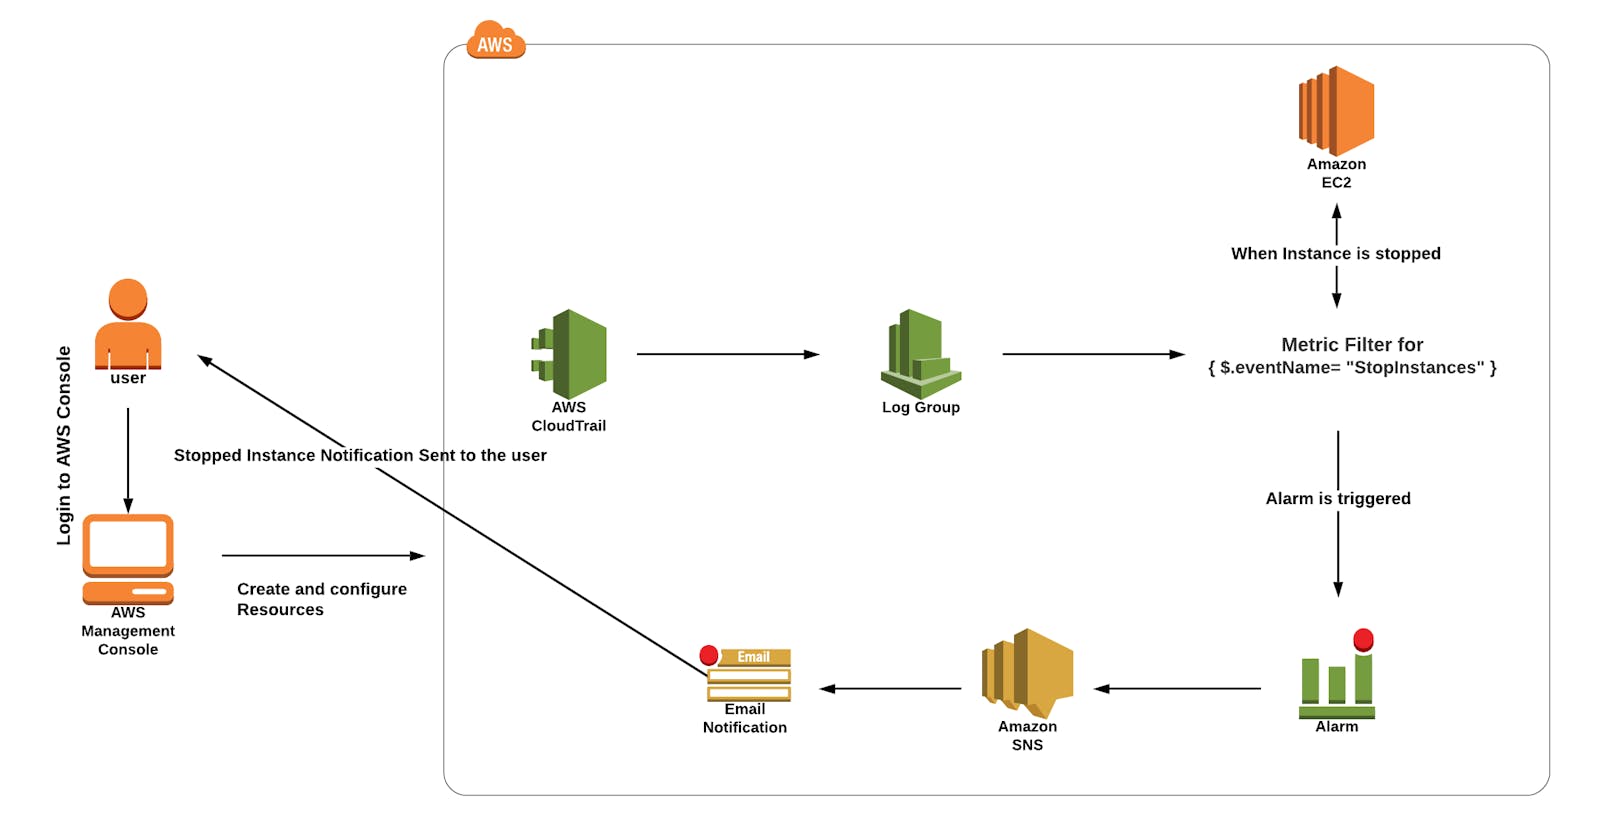
AWS Access Control Alerts with CloudWatch and CloudTrail are mechanisms provided by Amazon Web Services (AWS) to monitor and track access and authorization events within your AWS environment. They help detect and notify you about potential security issues, unauthorized access attempts, and unusual activity.
Task 6: Validation Test
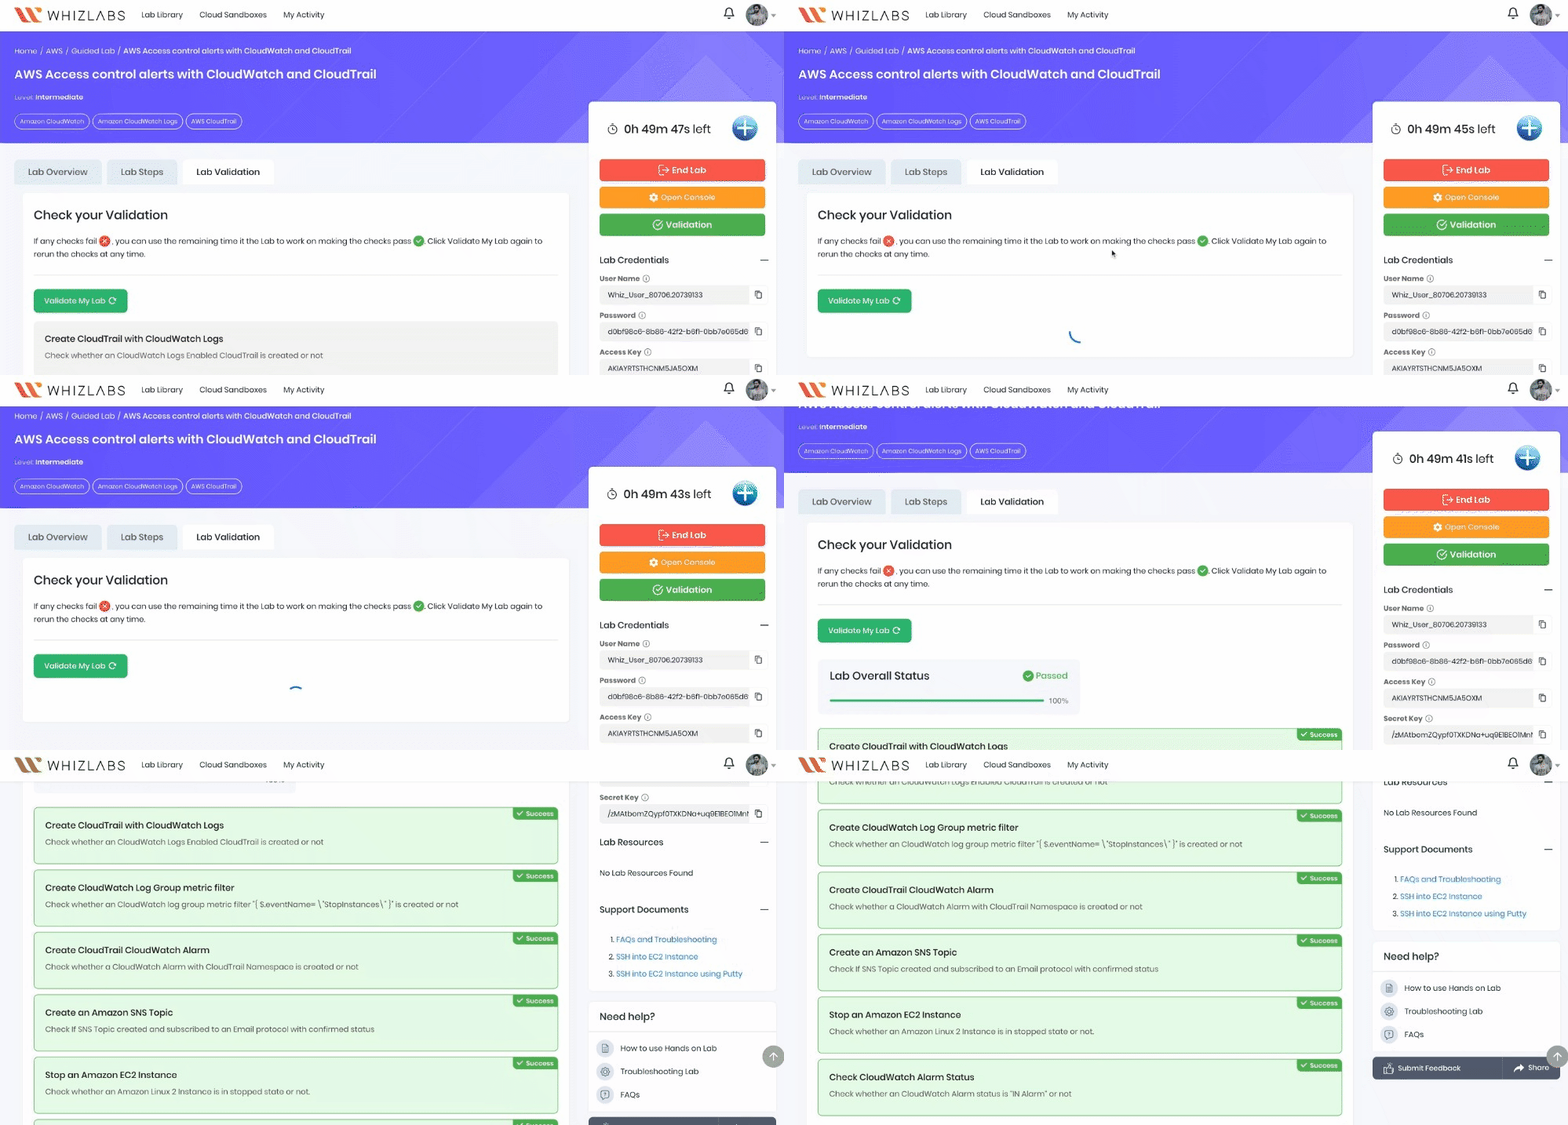
Once the lab steps are completed, please click on the Validate button on the Right side panel.
This will validate the resources in the AWS account and display whether you have completed this lab successfully or not.
Sample output :
Completion and Conclusion
You have successfully created a CloudTrail and an S3 bucket to store logs.
You have created CloudWatch log groups and a metric filter for stopped EC2 instances.
You have successfully created SNS topic to receive the alert from CloudWatch.
You have successfully launched an EC2 instance.
You successfully stopped the instance a few times to check the working of the alarm.
End Lab
Sign out of AWS Account.
You have successfully completed the lab.
