Table of contents
- 🔧 Essential Tools in Your Toolbox
- 🌌 Loki: The Proficient Log Aggregator
- ⏰ Prometheus: Unveiling Time-Series Insights
- 🚨 Seamless Alerting
- 💾 Data Sources: Where the Magic Begins
- 📊 Dashboards: Your Visual Portal to Data
- 🛠️ Getting Started: Installation Guides
- 🌐 Verify Your Loki Installation
- 📈 Craft Your Dashboard
Are you eager to explore the realm of monitoring and observability? Grafana stands as a powerful toolset that opens doors to comprehensive insights into your applications, encompassing logging, monitoring, alerting, and visualization.
🔧 Essential Tools in Your Toolbox
Before we dive into Grafana, let's introduce some indispensable components that enhance your observability toolkit:
Grafana: At the forefront of the action, Grafana offers a sleek interface for visualizing data and managing your observability stack.
Loki or Prometheus: You have the choice between Loki, a log aggregator, and Prometheus, a time-series database, for collecting and querying metrics and logs.
Promtail: For an enhanced Loki experience, Promtail steps in as a specialized log collector tailored for Grafana's Loki.
ELK Stack: Alternatively, you can opt for the classic ELK Stack (Elasticsearch, Logstash, Kibana) for robust log analytics.
Splunk and New Relic: These alternatives provide distinct avenues for exploration if you're considering diverse options.
🌌 Loki: The Proficient Log Aggregator
Meet Loki, your trusted log aggregator. It diligently collects logs from various sources, rendering them easily searchable. Loki is akin to a digital detective, helping you uncover issues within your applications.
⏰ Prometheus: Unveiling Time-Series Insights
Prometheus serves as your dedicated time-series database, proficiently storing and retrieving metrics. It functions as the heartbeat of your observability strategy, ensuring you're constantly informed about your system's well-being.
🚨 Seamless Alerting
Grafana's alert rules empower you to establish custom alerts that keep you informed about critical events. Define contact points and notification policies to guarantee you're always in the loop.
💾 Data Sources: Where the Magic Begins
Data sources form the lifeblood of Grafana. They pull data from diverse platforms, delivering a holistic view of your system. Whether your data flows in from Prometheus, Loki, or other sources, Grafana ensures it's at your fingertips.
📊 Dashboards: Your Visual Portal to Data
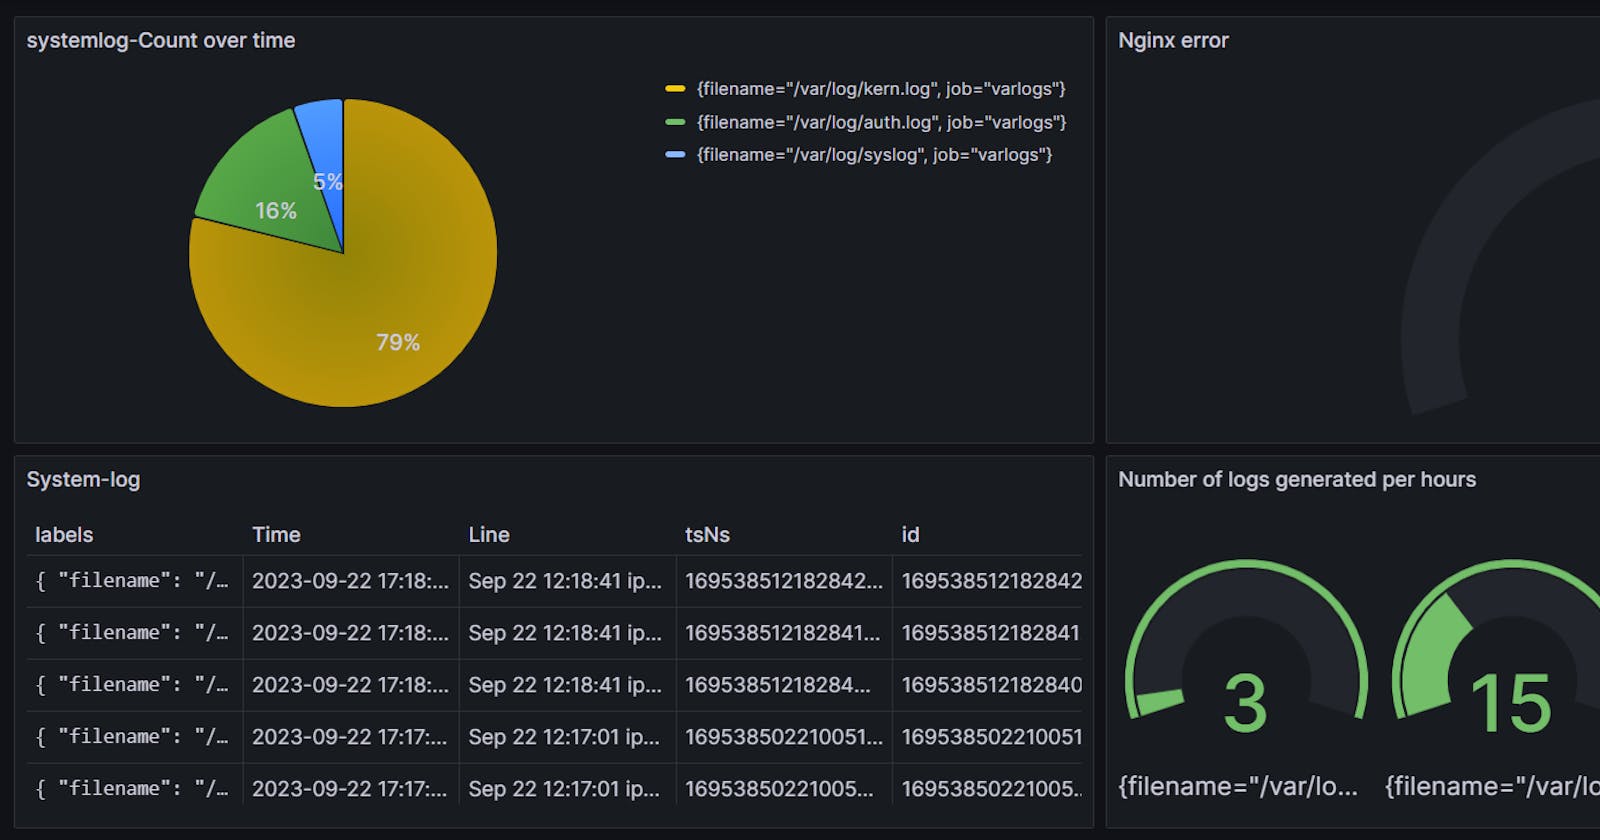
Dashboards are the canvas where magic transpires. Grafana's intuitive interface allows you to craft captivating visualizations, transforming raw data into actionable insights. Observe real-time data, track trends, and identify anomalies effortlessly.
🛠️ Getting Started: Installation Guides
Are you ready to embark on your journey into observability? We've prepared convenient installation guides to help you set things in motion:
Install Grafana: This guide walks you through Grafana installation for Debian-based systems.
Install Loki with Docker: Utilize Docker to set up Loki, Grafana's esteemed log aggregator.
🌐 Verify Your Loki Installation
After installing Loki, it's crucial to ensure it's operational. Access it at http://your-server-ip:3100/ready to confirm that everything is in working order.
📈 Craft Your Dashboard
Now that your observability stack is primed, it's time to immerse yourself in Grafana and build customized dashboards. Visualize data, configure alerts, and glean insights like a seasoned pro!
Grafana acts as your gateway to unlocking the potential of monitoring and observability. Armed with versatile tools and a user-friendly interface, you'll have the power to make informed decisions driven by data, ensuring your applications run seamlessly.
Stay tuned for more exciting adventures in the tech world! 🌟
